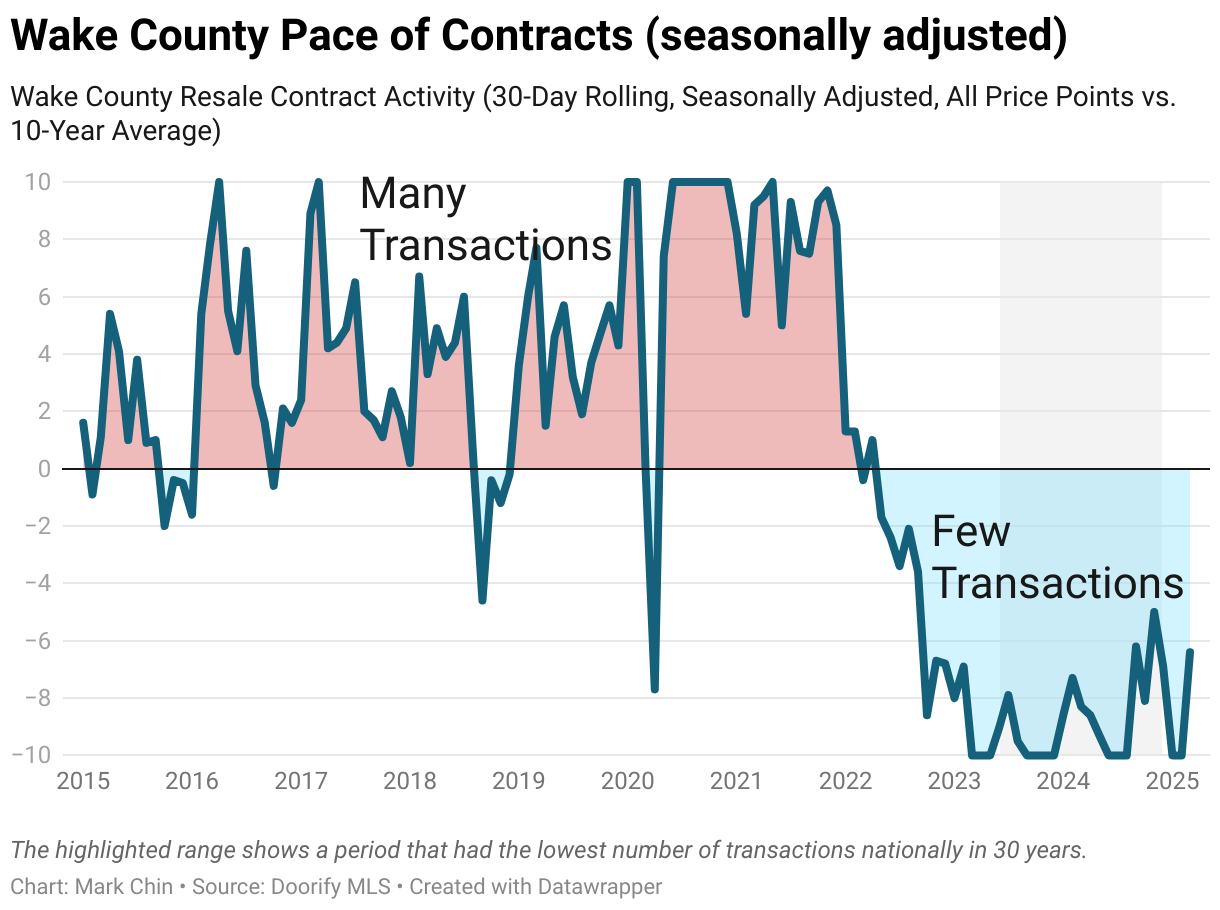
The Pace Index chart tracks market activity over time by showing fluctuations in contract activity over the past 30 days. High contract activity generally favors sellers, indicating a good time to list properties. Conversely, low contract activity can create leverage for buyers, offering better negotiation opportunities.
In short, sellers should watch for rising contract activity on the Pace Index chart, while buyers should look for declining activity.
While the Pace index chart focuses on recent contract activity, the Heat Index chart provides a broader view by comparing supply and demand to typical seasonal patterns. Use the Pace Index chart for insights into immediate market activity and the Heat Index chart for a wider understanding of market conditions.
For a longer-term perspective, also refer to the Monthly Contract Activity chart, which displays the total number of signed contracts each month.