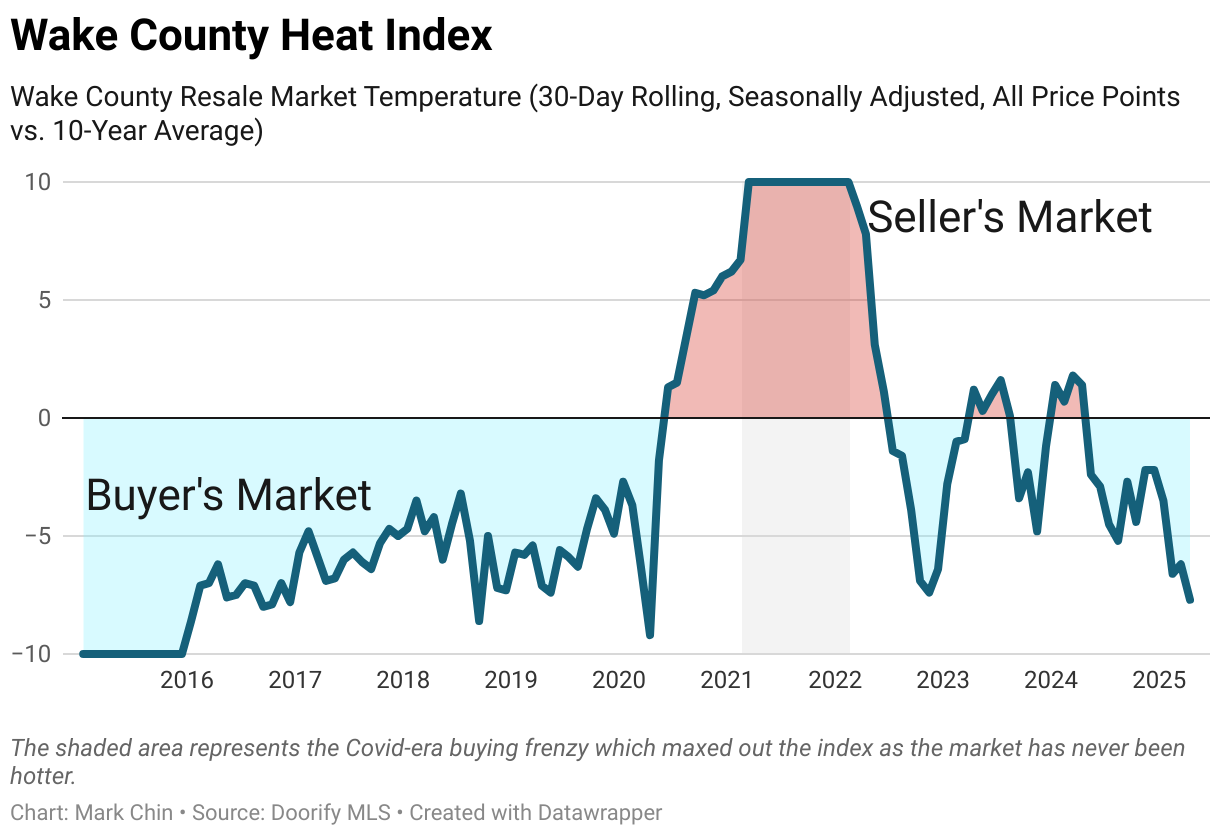
The Heat Index chart compares current supply (available properties) and demand (deals in the past 30 days) to typical seasonal levels. A positive value means the market is stronger than usual for this time of year, while a negative value indicates a weaker market.
This chart helps both buyers and sellers. Buyers can use it to find market conditions that favor them, and sellers can use it to determine the best times to list.
Use the Heat Index chart for a general understanding of whether it’s a buyer’s or seller’s market. However, don’t rely on it alone. Always consider other factors like pricing trends and inventory levels for a more complete picture.
Use the Heat Index for a general market snapshot. The Pace Index, which tracks contract activity over time, provides another valuable perspective on market dynamics.